
The article "PFD and BOD" draws a deep divide between the plant design and engineering phases and mentions three user interfaces (UI) for the automated design of desalination mega-plant. The figure below shows how to navigate to the said UIs (PlantDesign version 156). 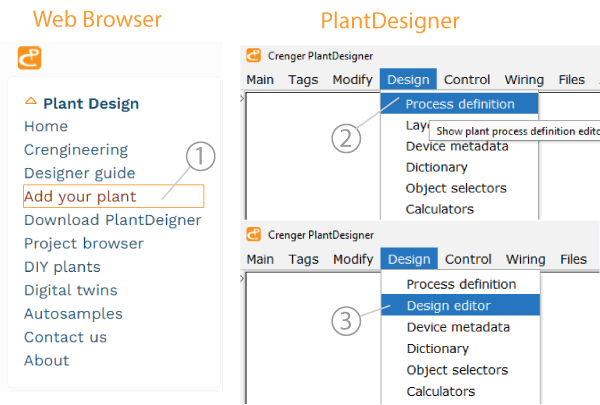
These UIs are like stepping stones half immersed in a datastream driven by domain-knowledge algorithms. Here our focus is not on the algorithms (they are discussed elsewhere) but on general principles driving the UI architecture and the scope of data needed to move from the plant design to its engineering.
Step #1
To initiate a project a user should input information describing its essential details, using a web browser and the "Add your project" menu. This project mini-specification should be an output of already executed feasibility studies - the planned future extension of the PlantDesigner software.
- a brief description of the problem the desalination plant is intended to solve
- a source water chemical analysis (seasonal), intake location, and a type
- produced water grade, quality, and production volume
- production reliability, flexibility, and operation modes
- environmental conditions
- standards for civil, mechanical, and electrical designs
- available power supply voltages, cost, and reliability
- instrumentation and control standards and data
- requirements for a drive start-ups and UPS
- design preferences and battery limits
- upload of feasibility study documents: plant layout, bathymetric map, sea bed map, isopach map, brine dispersion map
- fluid-compatible materials
- feed quality before reverse osmosis membranes
- RO membranes' performance projection points
- RO membranes' performance prediction tolerances
- plant main processes
- submittals list (work scope)
- commercial data
- technical requirements and provisions
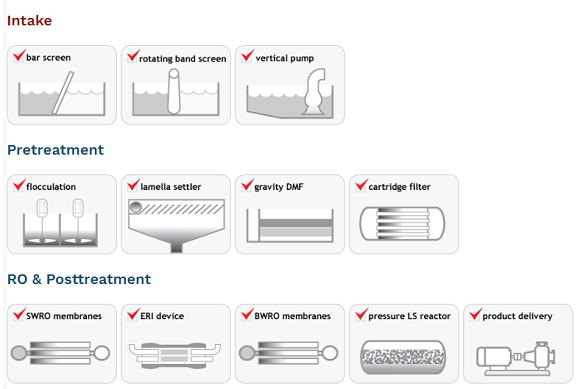
All the data is just numbers and words except for the plant's main processes describing a sequence of actions where order matters. As seen in the image below it is visually represented by icons simple to understand.
Step #2
To start this task, open PlantDesigner and click "process definition" in the "process" menu.
Processing of a client's request for a new project begins with a generation of mass-flow balances of treated water for standard operation modes forming a "design envelope".
Any operation outside of the envelope is considered abnormal. As the design and engineering phases further add operation constraints, they make this envelope slightly smaller.
Conventional engineering is incapable of following the design envelope philosophy due to a lack of industrial practices. Besides, it skyrockets the engineering costs and time.
The glaring question is how P&ID development may be done without operation modes superimposed. Lack of an answer is a serious enough reason for an EPC contractor disqualification.
The standard operation modes used in PlantDesigner are summarized below.
| default | time-averaged production |
| clean | clean non-compacted membranes, beginning of plant operation |
| clean low high | clean membranes, lowest feed salinity, highest feed temperature |
| fouled high low | fouled membranes, highest feed salinity, lowest feed temperature |
| average low | average fouling of membranes, lowest feed salinity, average feed temperature |
| average high | average fouling of membranes, highest feed salinity, average feed temperature |
The mass-flow balance for the operation mode is generated automatically using the predicted process water conversion factor C for a sequence of processes defined in Step 1. Predictions should not be accurate; they are re-validated at the next step.
The C factor links the requested plant production PRODUCT with the seawater intake capacity FEED. It works in a reverse direction to the process flow. For the reverse osmosis process, the C value equals the "recovery" ratio.
FEED = PRODUCT / (reliability * N * C1 * C2 * .... Cn) (1)
N = 1 - contingency (2)
The beauty of the above equation is that it treats physical process efficiency and plant reliability equally. That explains the reliability-associated entries in the form below.
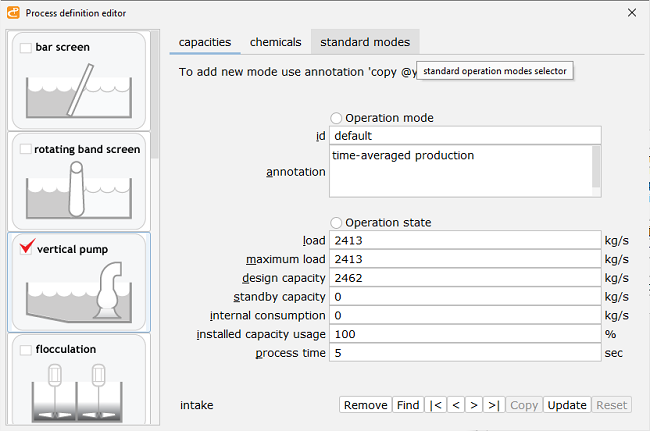
Here the user should select one of two design reliability scenarios.
- Adding standby capacity (the "standby capacity" field)
- Adding rotating in-built reserve capacity (the "maximum capacity" field)
Although the first option dominates desalination engineering, it is far from perfect - idle equipment may be exposed to higher corrosion rates and may feature higher rates of reliability degradation.
The desalination industry has not yet discovered the second way of design-for-reliability. It leverages the principle of temporary overload of the existing equipment (by a controlled shift of operation to its boundary). An example of rotating in-built reserve capacity is a pump equipped with an oversized motor and VFD.
This scenario is "high-hanging fruit" as it involves a process simulation not available to engineering companies.
Process time is a way to quantify a process's inertia. For instance, the time between a decision to start chlorination and actual execution may be measured in hours. Such auxiliary processes do not require standby capacities.
Production prediction contingency accounts for the client's input accuracy, the design calculation accuracy, and the process performance degradation with time. It is selected internally by software.
Step #3
Once the principal processes have been specified, the user may commence the plant design by clicking on the "design editor" of the "process" menu. The only input requested is the future plant plot.
This step - the plant design - is a jump from an abstract process to a concrete engineering system (ES). To implement a process several ESs may be needed.
An automatic design procedure includes 3 phases.
- the ES selections and inter-linking
- the ES sizing
- the ES arrangement image creation
The wealth of data generated should be somehow visualized in a compact way for studying, reviewing, and editing.
The approach selected by crenger.com is not what normally an experienced engineer expects to see. It is to use the plant layout - a set of the ES clusters - as a design navigator.
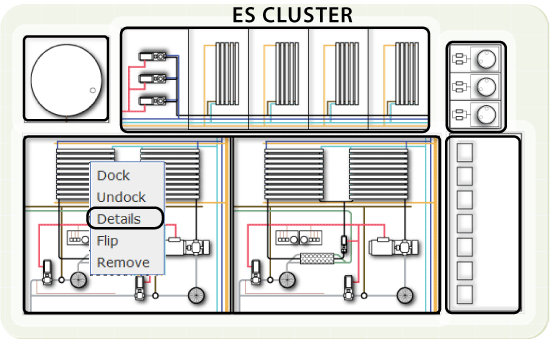
Currently, clusters are not created automatically; the user should "glue" or allow the loose ES arrangement to dock to the other and activate auto-aligning.
A double-click on the ES rectangle retrieves the design editor window containing the input and output fields. Internally, the editor is linked to an engineering calculator generating the output. Later, it is used for sizing of the P&ID items.
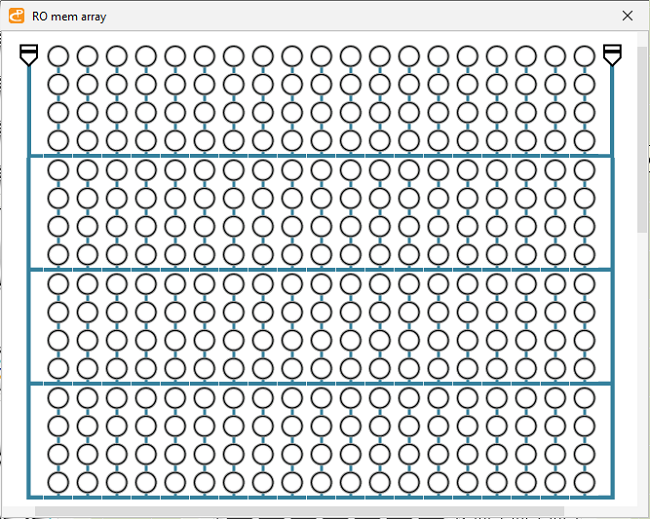
Undoubtedly, the RO membranes' array design is the heart of the plant. A part of this design is auto-generated P&IDs showing the RO membrane vessel arrangements for the multi-pass process. They may be viewed by clicking on the "Details" menu. The P&ID excerpt is shown below.
The design report in PDF format may be downloaded by clicking on the "report" menu.