
 Every second desalination mega-project ends up with costs overruns of up to 30% and/or delays of up to 6 months. These findings of the author raise many questions regarding the techniques applied to improve estimates of the contingency required in such situations.
Traditionally contingency is used not only to cover the unforeseen circumstances that might arise, but the project bidding shortcuts due to limited resources and tendering dead-line. In practice, contingency is a single flat figure amounting to 10%, which is added automatically to the project costs without regard to the actual project risks and the scope definition.
Such approach to contingency strips it off of its fundamental property - probabilistic character. We easily accept the 10% figure, but will strongly oppose to the 20% value with the probability of 50%, which amounts to the same 10%!
How does Crenger (www.crenger.com) identify the project risks and predict the project contingency?
How does it turn contingency from input to output?
First step in building the risks management system is to separate contingency from non-risk or easily predictable factors like incomplete project scope definition and prices volatility.
FEED
If I use the AACE Estimate Classes for the project costs accuracy prediction, I must admit that most of the mega-projects I participated were Class 4 corresponding to high-end range (p90) accuracy of the project costs estimate reaching +20 to +50% (Table 1). In chemical industry situation is quite the same; only few projects achieve Class 3; most are funded closer to Class 4 as well.
On the contrary, Crenger produces FEED packages (Front End Engineering & Design) corresponding to Class 1, which has high-end range 35% less!
| Range-of-ranges | |||
| AACE Class | Key deliverable status | Low end (p10) | High end (p90) |
|---|---|---|---|
| Class 5 | Process block flow agreed upon by stakeholders | -50 to -20% | +30 to +100% |
| Class 4 | Process flow diagram issued for design | -30 to -15% | +20 to +50% |
| Class 3 | P&ID issued for design | -20 to -10% | +10 to +30% |
| Class 2 | All specifications and datasheets complete | -15 to -5% | +5 to +20% |
| Class 1 | Most or all engineering and design work complete | -10 to -3% | +3 to +15% |
In Table 1 p10 and p90 figures are confidence levels, which are the percentage of probability (p) or confidence that the outcome will be less than the stated value.
Boundaries given in Table 1 are not symmetrical; they are biased towards positive values just to indicate that the project costs overruns are more natural than underruns.
Obvious question is if Class 1 raises the chances of the project award immeasurably, why not to move to it?
Table 2 gives a clear answer why it is not possible with conventional methods of project bid preparation. As seen moving from Class 4 to Class 1 increases the bid preparation effort by a factor of 5 to 25!
| AACE Class | Level of project definition | Preparation effort |
|---|---|---|
| Class 5 | 0 to 2% | 1 |
| Class 4 | 1 to 15% | 2 to 4 |
| Class 3 | 10 to 40% | 3 to 10 |
| Class 2 | 30 to 70% (Crenger FEED scope) | 5 to 20 |
| Class 1 | 50 to 100% | 10 to 100 |
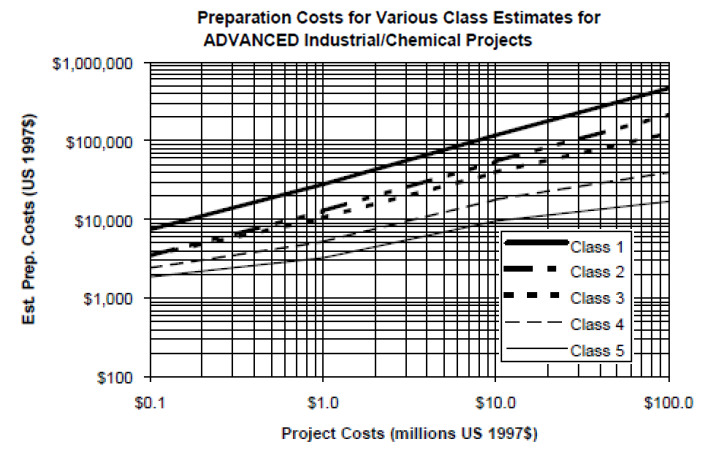
Using the AACE charts for the project estimate preparation costs we may find that for the 150 MLD SWRO desalination project the above-mentioned costs may reach US$500,000 (dollars of 2016). No mid-size contractor may allow such expenses.
Now hold your breath.
Crenger produces Class 1 FEED packages just in 50 man-hours.
Materials & Labor Price Adjustment
There exists a considerable time lapse between quotation, acceptance of tender and commencement of the project execution. If the bidder is committed to a fixed price at the tender date then all subsequent increases in cost during the project engineering and throughout the construction period, must be borne by the bidder unless a provision is made in the quotation to cover the risk of material and labor costs escalation. As seen in Figure 1 the prices of the stainless steel components variations are within -10% to +600% of the current levels!
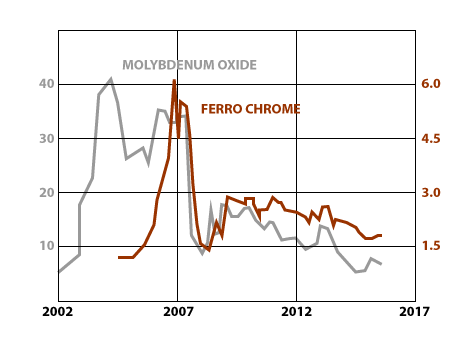
In the not distant past, the water treatment industry has tended to quote on a fixed price basis for the greater part of its turnover. Today, however, with narrowing project margins and preference for PPP & BOT contracts, there is a growing tendency for bidders to ask for a contract price adjustment clause to be included and for clients to accept its inclusion and thus ensuring fair distribution of risk and reimbursement for work done between both parties.
To create the price adjustment clause, Crenger selects from the database the standard equations for price adjustment and links them to the P&ID items and the purchase order packages.
These equations include readily available price indexes for materials, labor, fuel, electricity, and currency exchange rates. Next, Crenger iterates over the items in the order packages and produces project contract price adjustment equation to be pasted into the commercial offer. Example of this equation is given below for a 150 MLD SWRO desalination plant recently added to the samples portfolio. (Current version does not fully cover civil engineering yet.)
| Indexed expenditures, $USA | 66,780,000 | |
| No | Index | Weight |
| 1 | UBLS(electronic components and accessories) | 0.028 |
| 2 | LME(copper) | 0.072 |
| 3 | ENR(skilled labor) | 0.097 |
| 4 | LME(steel) | 0.392 |
| 5 | ENR(cement) | 0.086 |
| 6 | LME(nickel) | 0.058 |
| 7 | UBLS(general purpose machinery and equipment) | 0.014 |
| 8 | UBLS(industrial chemicals) | 0.128 |
| 9 | ENR(construction wage) | 0.078 |
| 10 | LME(aluminum) | 0.002 |
| 11 | UBLS(electrical machinery and equipment) | 0.045 |
| Total | 1.000 |
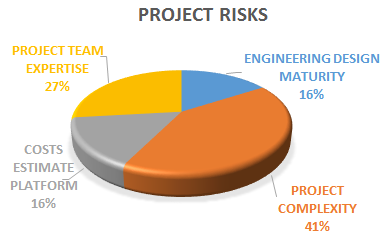
Project Complexity
AACE selects as the project complexity indicator the number of steps in the block-flow diagram. Today, with the Big Data at hand such single-indicator approach seems inadequate.
Crenger introduces a series of new indicators for the engineering and management groups. They are all readily available or deduced from the FEED data and the project metrics, which includes over 110 indicators.
Engineering complexity indicators include the following.
- Number of unique steps in the process block diagram (8)
- Total number of the project updates (3759)
- Total number of the acceptance tests (1286)
- Total number of vertical pumps above 250 kW (0)
- Total number of P&ID items with high vibration risk (13 out of 50)
- Plant process plot area(3.2 m3/(m3/h))
- Requested operation flexibility level (constant daily production)
Figures in brackets are given for the 150MLD desalination plant sample.
Recommended industrial practices for vibration risk assessment are based on Guidelines for the avoidance of vibration induced fatigue failure in process pipework, 2nd Edition, Energy Institute, London, January 2008.
Specific process plot area (per unit of production) is an indicator of the mechanical and civil engineering complexity. Equipment layout congestion directly affects the design goodness and safety. Values below 2.5 raise serious mechanical challenges for new site and more grave ones for existing facilities.
Operation flexibility does pose a sensible risk, which is openly admitted by all leading technology providers. Generally, the risk management shall address any fear expressed publicly during desalination discussions. (If you are curious to know how to shut desalination system on and off daily, here is a link.)
Management group indicators reflect complexities of collaboration and outsourcing and customized equipment procurement.
- Number of subcontractors (1)
- Number of purchase order packages with the pre-qualified vendors quantity less than 3 (17)
- Bid/no-bid analysis score
The more subcontractors, the higher risk of overruns due to the outsourcing scope incomplete definition. Low number of bidders raises the risk of the bidders not meeting the project requirements. The bid/no-bid score is the only indicator, which addresses the risks going beyond the FEED scope. (Bid/no-bid analysis will be available on-line soon.)
The described system of risk indicators is dynamic; it is updated with every new project addition.
Engineering Design Maturity
One of the key requirements of any megaproject is cautious usage of new technologies. Actually, most tenders allow only equipment and processes with proven good operating records. On the other hand, innovations are necessary to achieve better performance, to better the chances of winning the project. So any project is a mix of technologies ranging from conventional to commercially unproven.
This range will be never fully matched by the company expertise and experience.
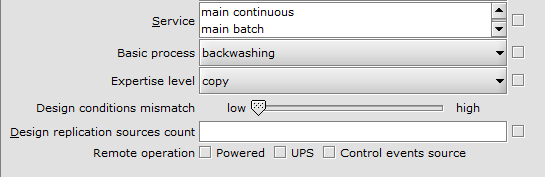
The risk assessment of the concept-expertise mismatch starts from the project block flow diagram, in which every node is described by a verb: to pump, to filter, etc. In fact, these nodes denote actual subsystems of the project. For each subsystem - equipment module - Crenger collects the data about the engineer expertise level, design conditions mismatch (comparing to the project requirements), and a number of design replication sources.
Engineering design maturity indicator is defined by combining the above-mentioned input values. It is the most powerful one.
Costs Estimation Platform Maturity
Crenger uses a customizable library of the component cost predictors. They are a result of regression analysis application to a database of the vendors' quotations.
Each predictor stores a costs function, which is periodically auto-adjusted to the materials and labor prices escalation, and the inflation rates. This function knows how to find the proper P&ID item, scan its attributes and physical parameters - the purchase datasheet entries - and produce the price estimates for procured equipment, installation, materials, and, of course, contingency. The only customization allowed is selecting the type of cost estimate - optimistic, mean, or pessimistic.
Crenger introduces 2 indicators - important risk drivers - representing estimating-quality uncertainty.
First indicator is the average life of the costs predictors applied to the project. At the end of life the accuracy is the lowest. For example, the standard set of the Crenger predictors has a life of 227 days.
The second indicator is the rate of the predictors update. More updates mean more up-to-date input on the equipment costs.
Project Team
By AACE the project team is a source of systemic risk. Depending on the team experience levels (ranging from immature to full staff) contingency adder may vary from -10% to +10%.
Crenger replaces this subjective approach with the following 2 indicators of the team adequacy to the project tasks. First reflects the quality of the team performance; it takes into account the number of inconsistencies found during the project auto-auditing by Crenger. Depending on the project phase, Crenger runs up to 100 auditing tasks weekly. On the average the "freshly-baked" FEED package contains between 300 and 600 inconsistencies! Unlike design errors they do not block the bidding progress but will block the project execution after award.
The second one assesses the team accumulated previous experience reflected in the digital resume auto-created by Crenger. My post "Resume is Dying. Welcome Digital Signature!" explains how Crenger tracks the user digital experience.
Financial Risks
The picture would not be complete without mentioning the financial risks. The post of Carlos Leal is an excellent introduction into this topic.
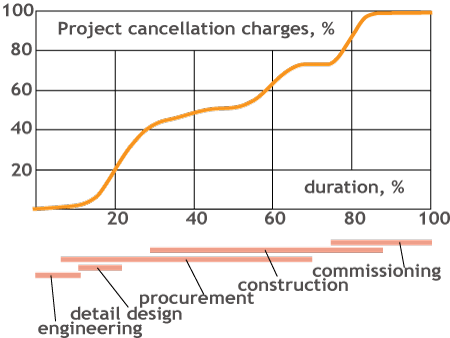
Paradoxically, the biggest financial risks come from the technical side. The latest example is cancellation of US$ 1.4 billion EPC contract between SWCC and Samsung Engineering after 55% of project work scope has been executed, the cause being disagreement over the technical requirements changes.
Crenger mitigates such risks by auto-generating the cancellation charges curve and adding it to the commercial offer. It was never done in the megaprojects I participated.
Biases & Historical Data
Today, in slow economic times, rare EPC contractor of desalination plants may boast a steady stream of megaprojects. For example, the internet search for the biggest EPC contractor of desalination plants revealed that its last award (188 MLD SWRO) had been in December, 2013. Such a prolonged time-out may mean the loss of the team's jobs. On the other hand, it boosts immensely the optimism bias and overconfidence of decision makers. The bigger the next project, the more this bias will create pressure for optimistic cost estimate.
Contingency framework as described above is a must but not enough to counteract this bias: historical data is needed to fine-tune and seal tight this framework. The more the data, the less bias is and more chances to win the next project.